
Key Programme Achievements (2011 - 2025)
221,303
Number of adults and children currently receiving ART

1.86 Million+
Number of notified cases of all forms of TB
2.42 Million+
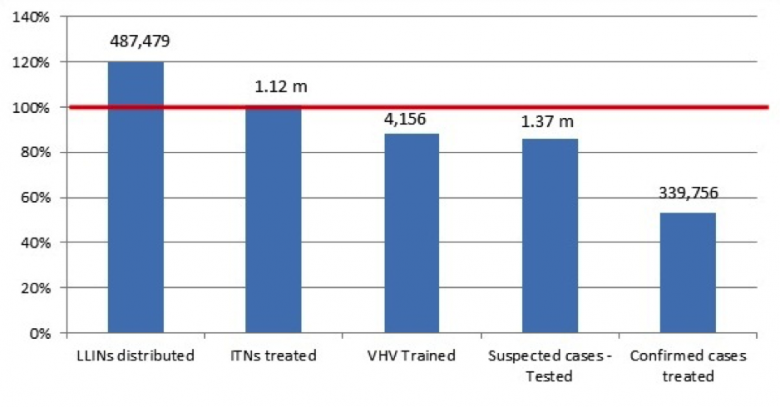
Number of confirmed malaria cases treated
28,783
Number of MDR-TB cases that began second-line treatment
136.8 Million+
Number of condoms distributed free of charge to KAP
88.8 Million+
Needles and syringes distributed to people who inject drugs

15,042
Number of PWID on opioid substitution therapy

31.2 million+
Number of malaria tests performed (RDT and slides)